1. Introduction
An insurance company’s financial results are inherently uncertain due to the unpredictable nature of indemnity events, such as natural disasters and frequency of individual claims, and economic fluctuations, which impact the company’s investment returns. These uncertainties can significantly impact the financial stability and performance of an insurance company. Risk modeling allows insurers to identify possible risks and quantify their potential impact. By analyzing possible sources of risk, insurance companies can develop better underwriting strategies, optimize their investment portfolio, and ensure adequate reserves.
The risk sources do not exist in isolation; they interact and diversify in ways that are sometimes beneficial and other times detrimental to the insurance company. For example, an economic downturn might simultaneously decrease investment returns and increase claim frequencies, impacting both asset and underwriting risks. Insurers must understand the dependencies among risk sources to quantitatively analyze the overall levels of risk.
The optimal way to model dependency among various sources of risk is to embed the underlying economic, social, and legal conditions such as interest rate, economic growth, inflation, legislative change, and insurance regulations within the underwriting risk model, the reserve risk model, and the market risk model. With this approach, no explicit correlation needs to be modeled because the underlying variables would simultaneously determine the outcome of multiple risk sources.
Many large companies attempt this approach. For smaller companies that lack the extensive staff to conduct modeling but are still required to analyze these risks, incorporating such underlying economic conditions into their underwriting and reserving processes may not be practical; therefore, smaller companies may use a simpler model that does not incorporate many of these economic conditions. Consequently, the intrinsic “common cause” driving the dependencies among various risks may be lost, which then necessitates explicit correlation modeling among various risks.
2. Study scope and methodology
This study was undertaken by the members of the CAS Risk Working Group and aims to empirically quantify the correlation factors among various risk sources pertinent to an insurance company. The study addresses the key question of how individual risk sources interact.
This paper does not examine line-of-business level correlation within underwriting risk or reserve risk, as these statistics are extensively researched (Roth 2020).
2.1. Sources of risk and their representation
Underwriting risk for the purpose of this study is the risk of an underwriting loss in the current year. It does not include adverse reserve development from prior years; however, it does include current year catastrophe risk. The data used to study correlations in this study cannot explicitly differentiate losses due to catastrophe from losses due to non-catastrophe events. Therefore, for the purpose of this study, underwriting risk includes catastrophe risk. This study represents underwriting risk by the ratio of the sum of current year incurred losses and the acquisition expenses divided by earned premium. A larger ratio is detrimental to the insurance company.
Reserve risk refers to the potential of reserves developing adversely. This study represents reserve risk by the reserve development ratio, i.e., prior-year adverse development in the current year divided by the opening net reserve balance. A larger reserve development ratio is detrimental to the insurance company. Reserve risk can be quantified using the bootstrap method (Shapland 2016) or estimated based on a closed-form formula (Feng and Robbin 2022).
Insurance risk is the potential of losing money in an insurance portfolio. This study represents insurance risk by the current year underwriting ratio, i.e., the ratio of the sum of incurred losses (current year and prior adverse development) and the acquisition expenses divided by the premium earned. Insurance risk includes both the current year’s losses and prior-year developments and combines underwriting and reserve risks. A larger underwriting ratio is detrimental to the company.
Market risk is represented by investment loss as a percentage of invested assets. Investment losses include realized capital losses and unrealized capital losses, offset by interest and dividend income. A larger loss percentage is detrimental to the company. Market risk is usually derived based on a simulation of the asset values.
Operational and strategic risk are represented by the ratio of negative “Ins Other Income and Expenses” divided by earned premium. According to S&P, other revenue and expense amounts consist of “other noninterest income and nonrecurring revenue minus nonrecurring expense” (S&P Global 2025). These usually result from a company’s strategic decisions, i.e., gain realized when selling a subsidiary or division, or one-time charge as a result of layoffs. Larger amounts are detrimental to the company.
2.2. Data availability
The data underlying this study comes from CAS subscriptions to S&P Capital IQ (S&P Global, n.d.). The Risk Working Group has not examined the accuracy of the data. For each insurance company, S&P has hundreds of different potential variables that are candidates for inclusion in this study. In considering which variables to include, the Risk Working Group took into account the data availability in terms of number of years and number of companies with available data.
The list of eligible companies is limited to those with over $1M property and casualty net earned premium in 2023. Companies classified as “Life & Health” that had no property and casualty net earned premium were excluded from this study, but “Life & Health” focused companies with more than $1M in property and casualty net earned premiums were included.
Reserve risk data is available primarily for North American insurers. Nearly all data fields within S&P Capital IQ related to prior-year reserve development or adverse reserve development have fewer than half of companies reporting available data. Consequently, substantially fewer companies reported reserve risk data than reported insurance risk data; this lack of reserving data prevented separating reserve risk from underwriting risk. Table 1 illustrates the number of companies with the data needed to compute various metrics.
A review of the extracted company data revealed many subsidiaries of companies within the same parent company group, many of which reported the same underwriting results each year. These were considered duplicate records and excluded from the study, leaving 871 companies for analysis.
2.3. Company classifications
Recognizing that companies of different types, sizes, and geography face different decision-making processes and may have different correlations among risk sources, correlation factors were closely examined based on company type, company size, and geographical classifications.
2.3.1. Company type
Company type is based on S&P’s primary industry (Variable 275904) and falls under one of the following categories: reinsurance, property and casualty, multiline, life and health, and other. The “other” category includes financial guaranty, mortgage, and title insurance. The classifications were assigned by S&P, so the Risk Working Group was not in a position to challenge them.
2.3.2. Company size
Smaller companies may use different correlation factors than larger companies. Consequently, correlation factors are reported for four company size categories based on 2023 earned premium—$100M or less, $100M to $1B, $1B to $5B, and over $5B. To determine the optimal size categories, the Risk Working Group varied the number and sizes of each bin and eventually settled on the four bins listed above because they provide the most homogeneous results while keeping each category sufficiently large to remain credible.
2.3.3. Company geography
S&P categorizes each company under one of six geographies (Variable 321214):
-
United States and Canada
-
Europe
-
Asia-Pacific
-
Africa
-
Middle East, or
-
Latin America and Caribbean.
S&P classified companies domiciled in Bermuda under “United States and Canada.” The Risk Working Group used the same geographical category as S&P.
Where possible, correlation factors were examined for each of the six geographies. However, most companies outside the United States and Canada lack credible reserve risk data. Therefore, the Risk Working Group additionally defined a “rest of the world” category that includes all countries outside the United States, Canada, and Bermuda. Some correlation factors have only “United States and Canada” and “rest of the world” categories and do not include a detailed breakdown of other regions such as Europe or Asia-Pacific.
2.3.4. Combination of classifications
The Risk Working Group considered presenting correlation factors for a combination of company classification to answer the question, “What is the mean correlation between underwriting risk and reserve risk for a $1.5B European multiline insurer?” However, analyzing correlation factors at such a granular level would significantly reduce credibility. Most such groupings have fewer than 10 companies before considering data availability at the variable level.
Instead, the Risk Working Group encourages practitioners to separately reference benchmarks for European companies, for multiline insurers, and for companies in the $1B to $5B category and use their judgment to determine a more appropriate benchmark.
2.4. Measuring correlation
Correlation could be measured at many levels, one of which is the aggregated correlation across the entire industry. If the industrywide reserve development is tallied over 30 years and compared with industrywide market returns, this would generate an industry-level empirical correlation factor between reserve risk and market risk. However, industry-level correlation factors should not be applied to individual companies, largely because of diversification between results of different companies. A better benchmark is the correlation between comparable companies of similar size, asset mix, and underwriting portfolio.
Following this approach, this study calculated the correlation factor among various risk sources reported by over 800 individual companies and outlined the means and percentiles of the studied correlation factors across different companies. For each pair of risks studied, 30 years of historical underwriting, reserve, and investment data were used to compute the correlation factors. If a company did not have 30 years of history, correlation factors were computed using the available years, if the company had more than two years of data.
The study’s correlation coefficients were calculated using Spearman’s rank correlation coefficient, which, similar to Pearson’s correlation coefficient, has a value within the interval [–1, 1]. The Risk Working Group chose a rank correlation coefficient because it does not assume a linear relationship between the two risks being computed and the rank correlation is less impacted by outliers compared with Pearson’s correlation.
By using 30 years of historical data for over 800 companies, the impact of a wide range of underwriting and economic conditions on these companies can be observed. This study noted that using empirical correlation factors is only valid if it is assumed that historical correlation has prediction value for future correlations. Empirical correlation averages also do not sufficiently characterize tail correlation.
2.5. Interpretation of exhibits in this report
Most of the study exhibits are formatted similarly to Table 2.
As shown in Table 2, 694 companies of all types and sizes had sufficient data to compute the correlation between insurance risk and market risk. The simple average of correlation factors between insurance risk and market risk across all 694 companies was –27%, with a standard deviation of 47%; the median was –25%. Half of the 694 companies had a correlation factor between the 25th percentile (–64%) and 75th percentile (3%). Of the 694 companies, 103 are reinsurers, with a mean correlation of –11%. Exhibits showing details of other correlation types, company types, company sizes, and geography can be similarly interpreted.
2.6. Sign convention
The data underlying the study is defined such that larger amounts are unfavorable to the insurer. This is not necessarily consistent with the way models are configured. For example, when examining market risk and insurance risk, this study has a mean correlation of –27% between market loss and insurance combined ratios. In practical modeling, it is more common to model insurance incurred loss amounts and investment income. In this case, the signs for correlations between insurance risk and market risk should be reversed. When referencing correlation factors in this study, practitioners should ensure that their own model defines variables in a manner consistent with this study’s model; if not, the sign of the correlation factors should be reversed, if necessary.
2.7. Tail dependency
Scatter plots were used to examine whether tail loss events exhibit certain associations that may behave differently around the mean (see Section 5). The Risk Working Group analyzed these plots and noted that the only noticeable tail correlations were between operating risk and underwriting risk and operating risk and insurance risk.
The Risk Working Group acknowledges that this rudimentary analysis may not be sufficient to identify nuanced tail relationships and that further research on this topic is needed to uncover dependency at the tail.
It is also recognized that metrics such as correlation do not adequately characterize the behavior of variables at the tail in general. The Risk Working Group recommends using one or more of the following tools to augment tail correlation modeling:
-
Use heavy-tailed copulas
-
Augment standard simulations with tail scenarios showing larger dependencies
-
Use a correlation factor at a higher percentile (or a lower percentile if signs are reversed)
3. Results: Insurance risk, market risk, and operational risks
This section explores the correlation factors between insurance risk, market risk, and operational risk observed for all companies studied. The mean factors for all companies in the study produce the correlation matrix shown in Table 3.
Detailed correlation factors in various segmentations of the companies are displayed in this section.
3.1. Insurance and market risk
3.2. Insurance risk and operational risk
3.3. Market risk and operational risk
4. Results: Detailed examination of underwriting and reserve risks
When insurance risk is dissected into underwriting risk and reserve risk, Table 16 expresses the mean correlation factors observed from all companies studied. It is noted that the number of companies with available underwriting and reserving data is approximately 25% of the total number of companies in the study, largely due to the lack of reserve development data from companies outside North America. Nevertheless, the Risk Working Group believes there is sufficient data for the result to be credible.
4.1. Underwriting and reserve risk
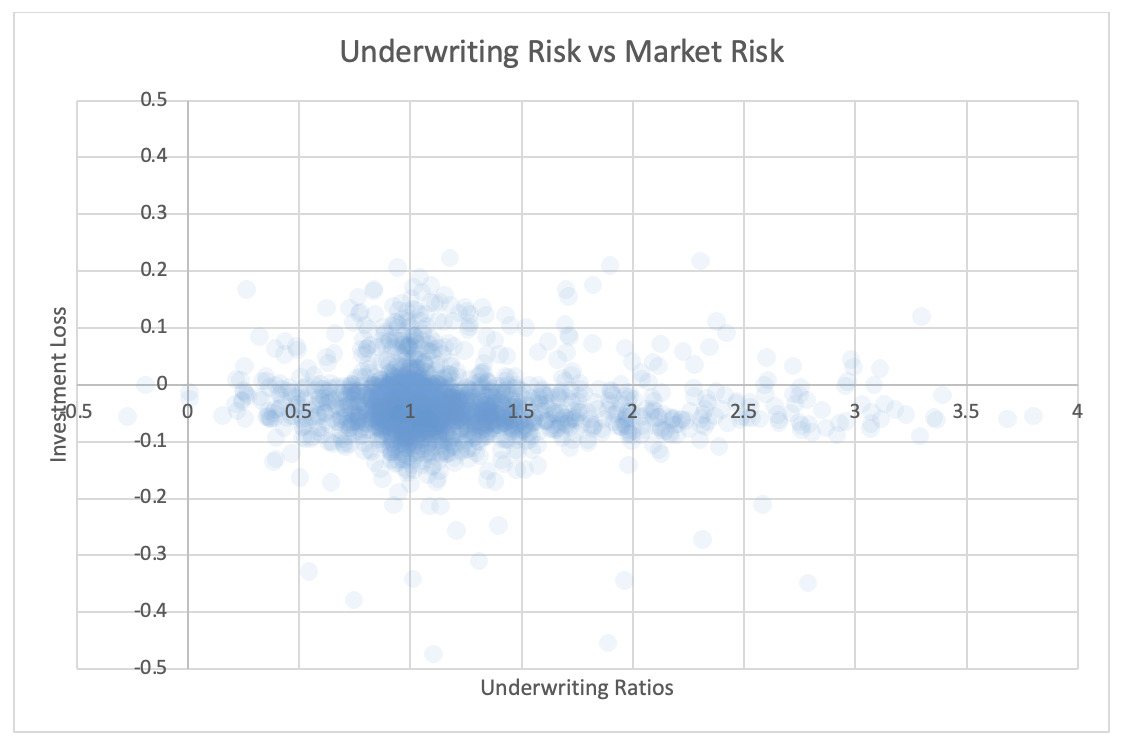
4.2. Underwriting and market risk
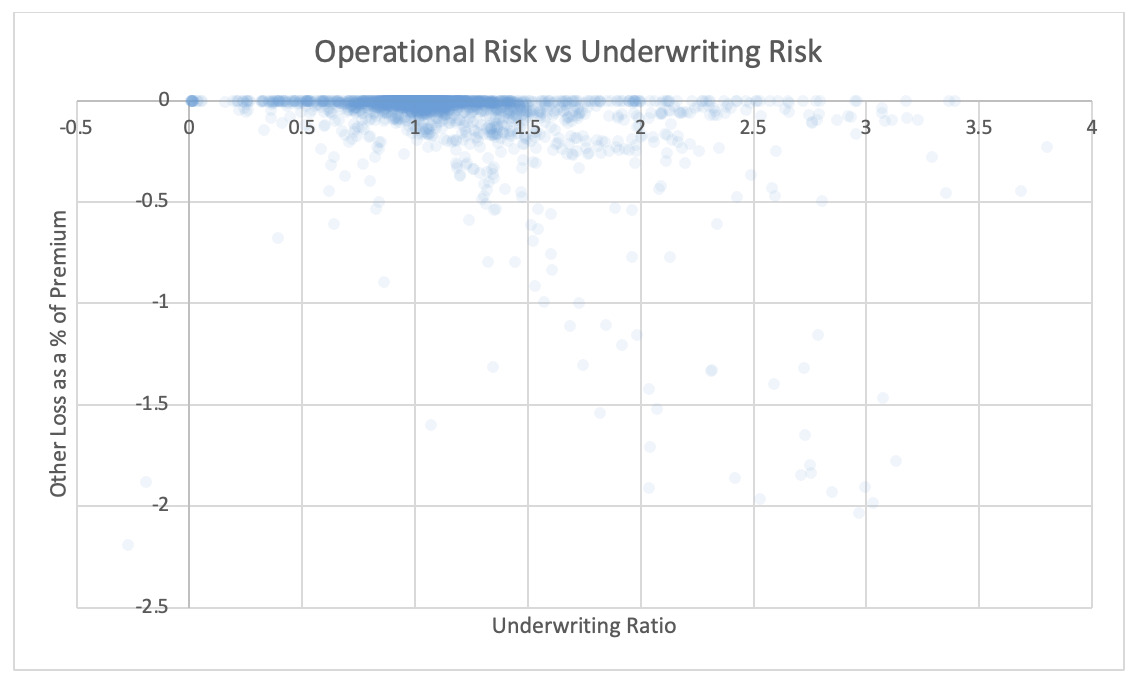
4.3. Underwriting and operational risk
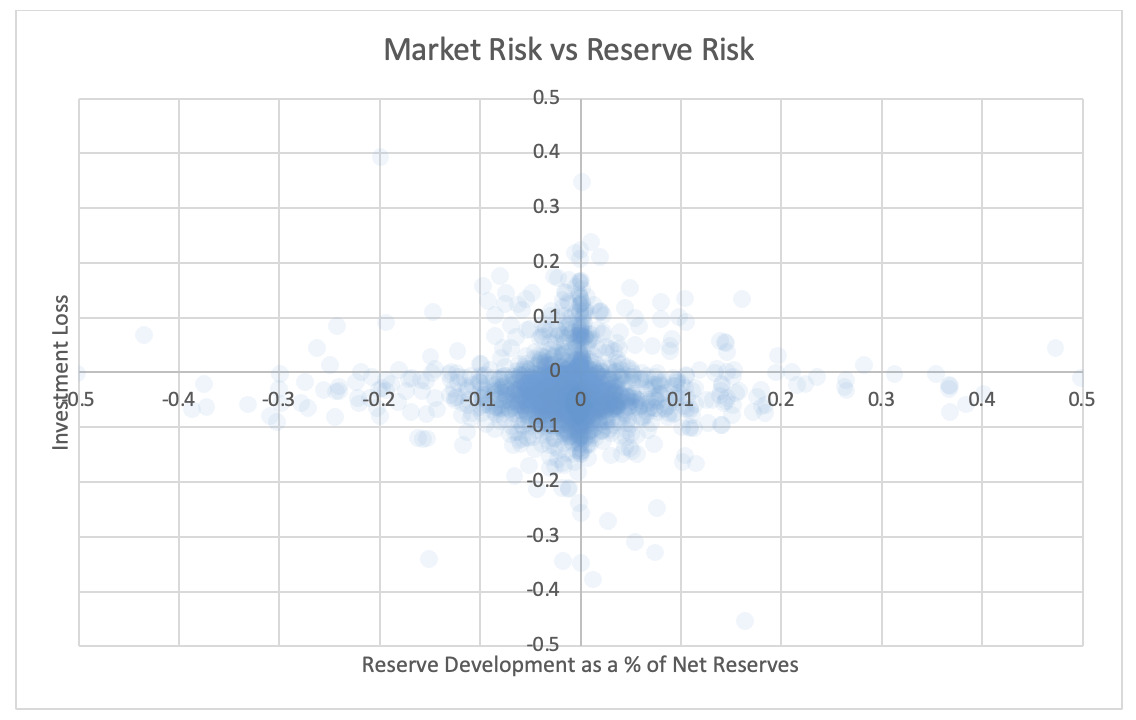
4.4. Reserve and market risk
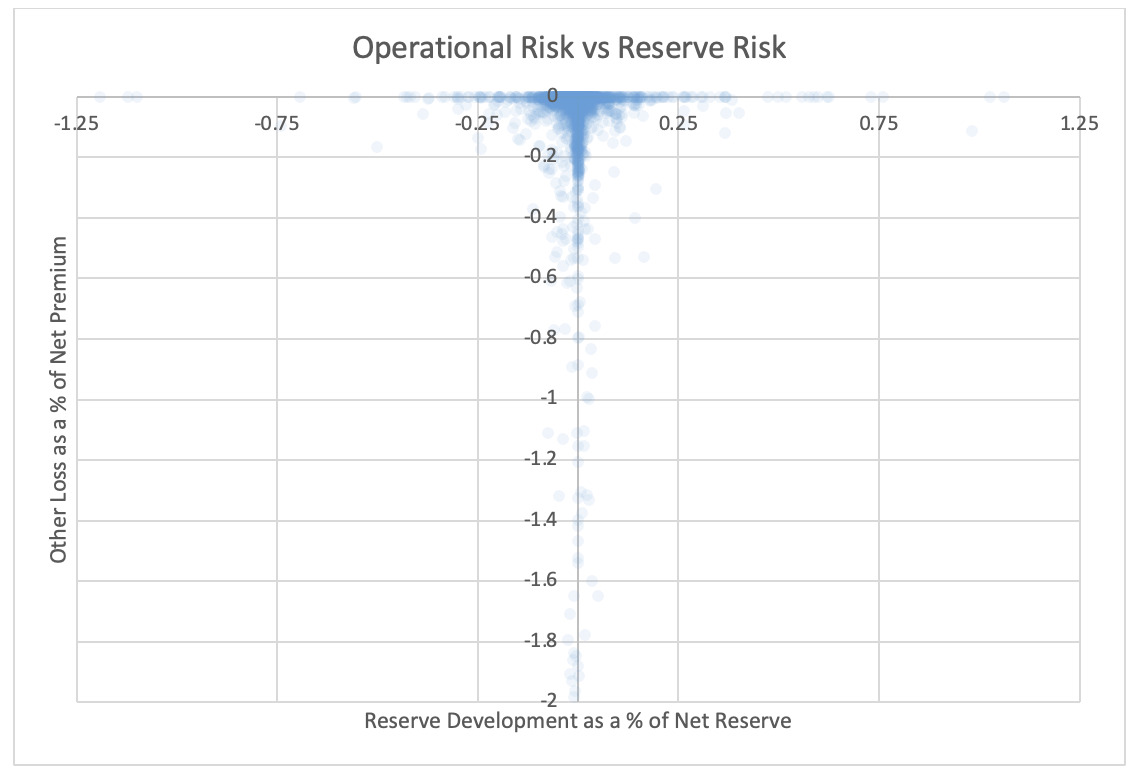
4.5. Reserve and operational risk
5. Tail correlation
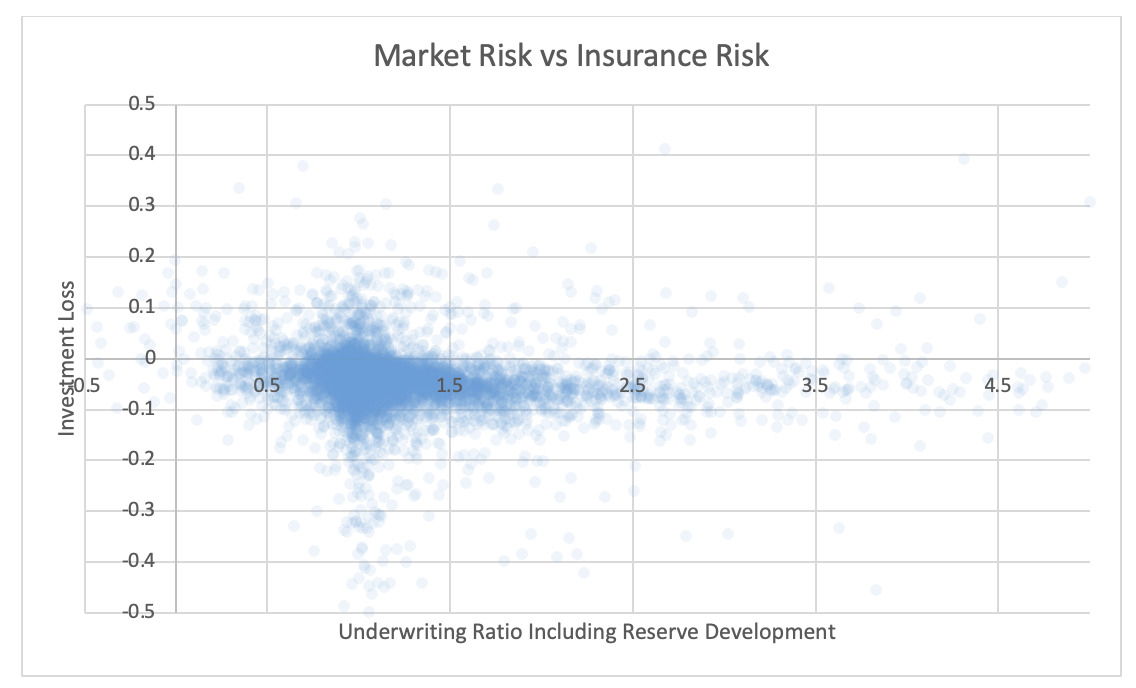
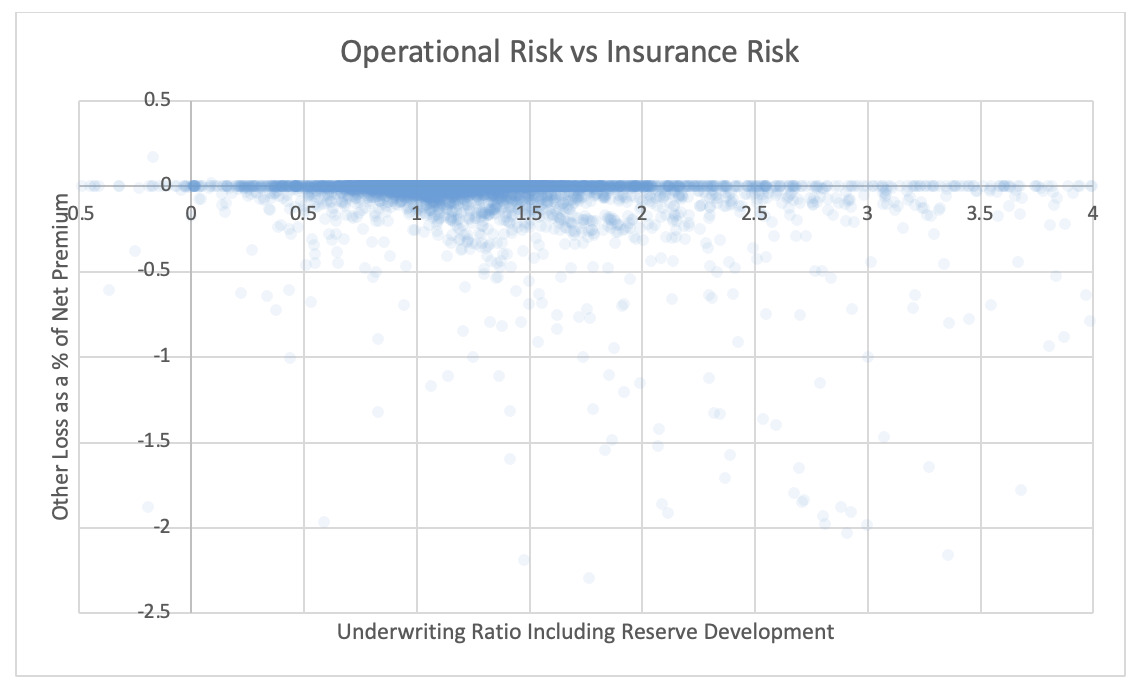
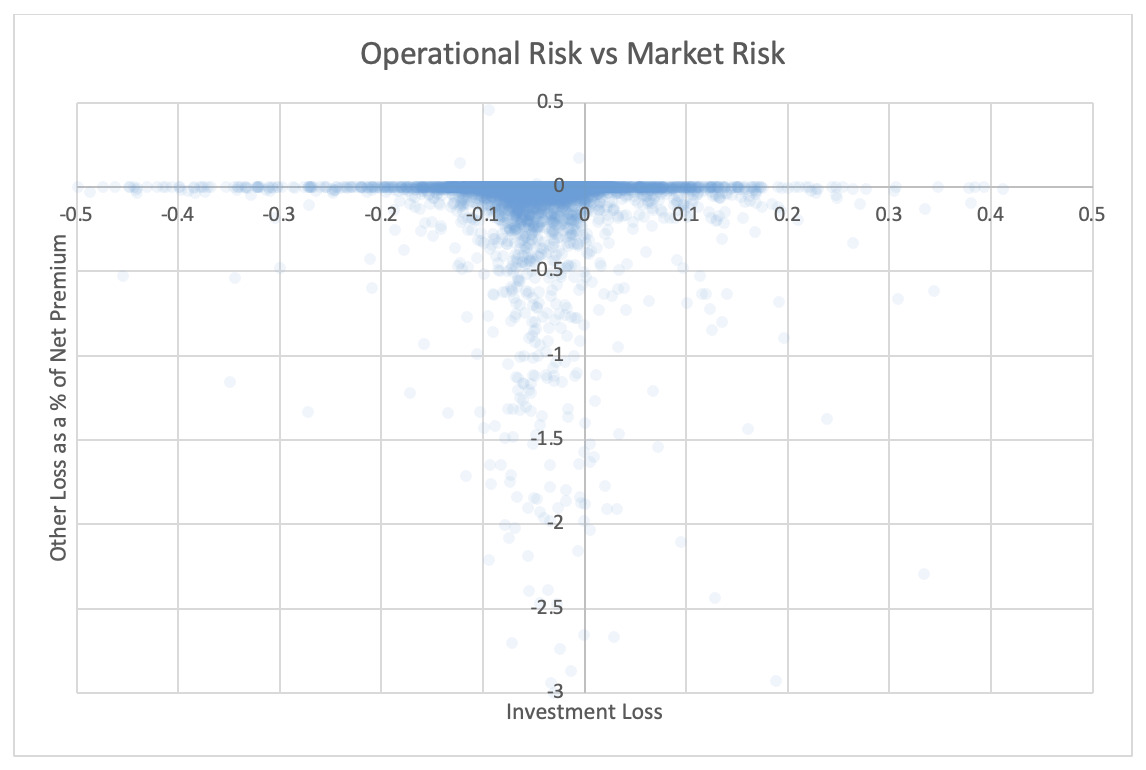
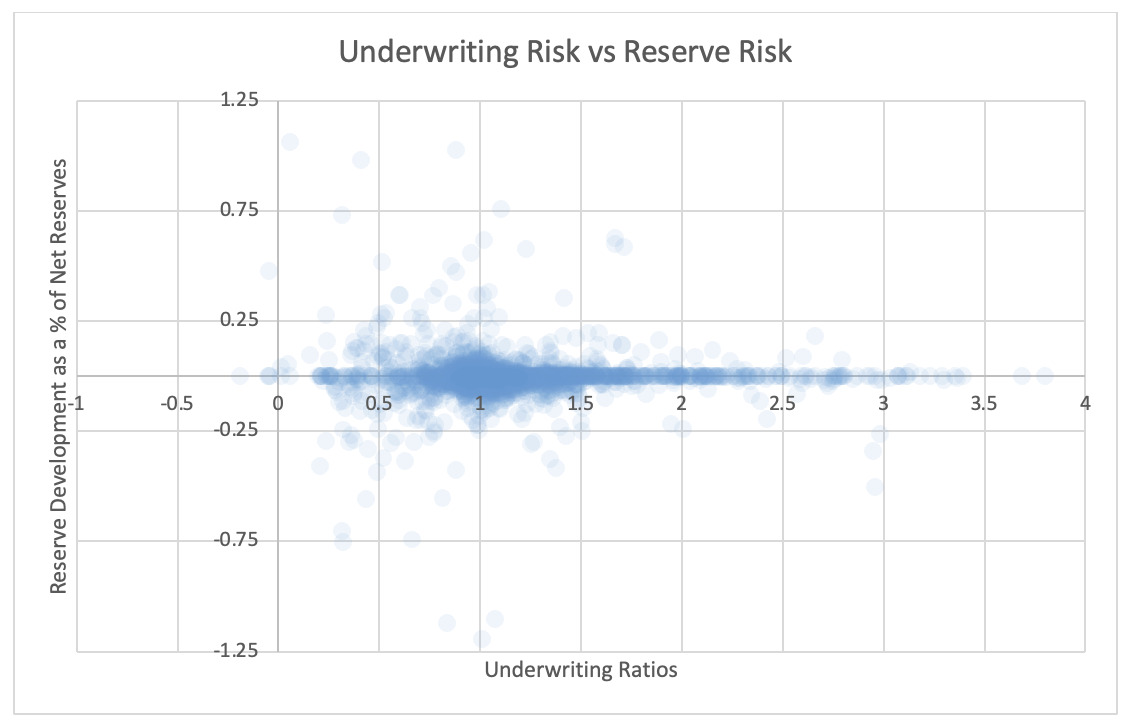
For each pair of risks noted in the tables, the Risk Working Group examined the scatter plots for potential patterns in the tail. In the plots in this section, each axis represents one source of risk and each data point represents one company and one financial year. Darker regions represent more concentration, i.e., more companies reported results in the region. Conversely, in the sparsely populated edges of the plots, individual data points can be more easily distinguished, making patterns more easily recognizable.
The Risk Working Group identified patterns of association only between operational risk and insurance risk and operational risk and underwriting risk. Other variable pairs did not exhibit any discernible relationship in the tail. The lack of noticeable association in the tail through graphical analysis may be attributed to the substantial volume of data, which potentially obscures actual tail relationships for certain companies.
The Risk Working Group acknowledges the shortcomings of the graphical analysis with the caveat that tail dependency may still exist despite the lack of any apparent graphical indication. Further research is required on this topic.
5.1. Scatter plots of insurance risk, market risk, and operational risks


5.2. Scatter plots of underwriting risk, reserve risk, market risk, and operational risks


About the Authors
The CAS Risk Working Group is one of the main CAS research working groups that plays a critical role in advancing actuarial science. This work contributes to the growing body of research that will support actuaries in their day-to-day functions, offer novel approaches to problem solving, and address current issues. The Risk Working Group addresses actuarial issues of property and casualty insurance risk modeling, quantification, theoretical research, and applicational methods in capital modeling, pricing, and reserving. The working group is charged with proposing, supporting, and promoting innovative research and practical projects that enable the evaluation of risk, and with presenting our supported research and project results to the CAS membership.
Yu Shi “Andy” Feng is a capital modeling actuary at TransRe, with over 10 years’ experience in the industry. He previously held risk and reserving roles in Starr Companies and PwC. Andy holds a bachelor’s degree in mathematics from the University of Waterloo in Canada. Andy is extensively involved in CAS volunteer activities, including chairing the Risk Working Group and participating in the Exam Working Group and the planning committees for the Enterprise Risk Management Symposium and CAS Reinsurance Seminars.
Asiri Gunathilaka serves as an associate director within the Insurance Consulting and Technology division at WTW. He has over 12 years’ experience in the property and casualty insurance industry, specializing in actuarial analysis across a broad range of areas, including reserving, pricing, economic capital modeling, enterprise risk management, risk transfer testing, alternative risk financing, claims cost management, and business process automation. Asiri holds a PhD in actuarial science from the University of Connecticut. He is a Fellow of the Casualty Actuarial Society and a member of the American Academy of Actuaries.
Antoine Neghaiwi is a former chief actuary with a 30-year international career. He retired as chief pricing actuary and senior advisor to the CEO at SCOR and as a member of the global P&C senior management team and the Risk & Capital, Underwriting, and Planning Committee. Prior to SCOR, Antoine was chief actuary at Converium, overseeing all non-life actuarial functions, including pricing, reserving, and modeling. Before Converium, he was chief pricing actuary at XL Global Insurance, where he founded the global pricing function. Antoine’s formative career was spent at Liberty Mutual Insurance Group and with Aetna Life & Casualty, where he gained his Casualty Actuarial Society Fellowship.